2026-09-09 7:53 CET, Europe | Catella Group, Investment Management | Press release
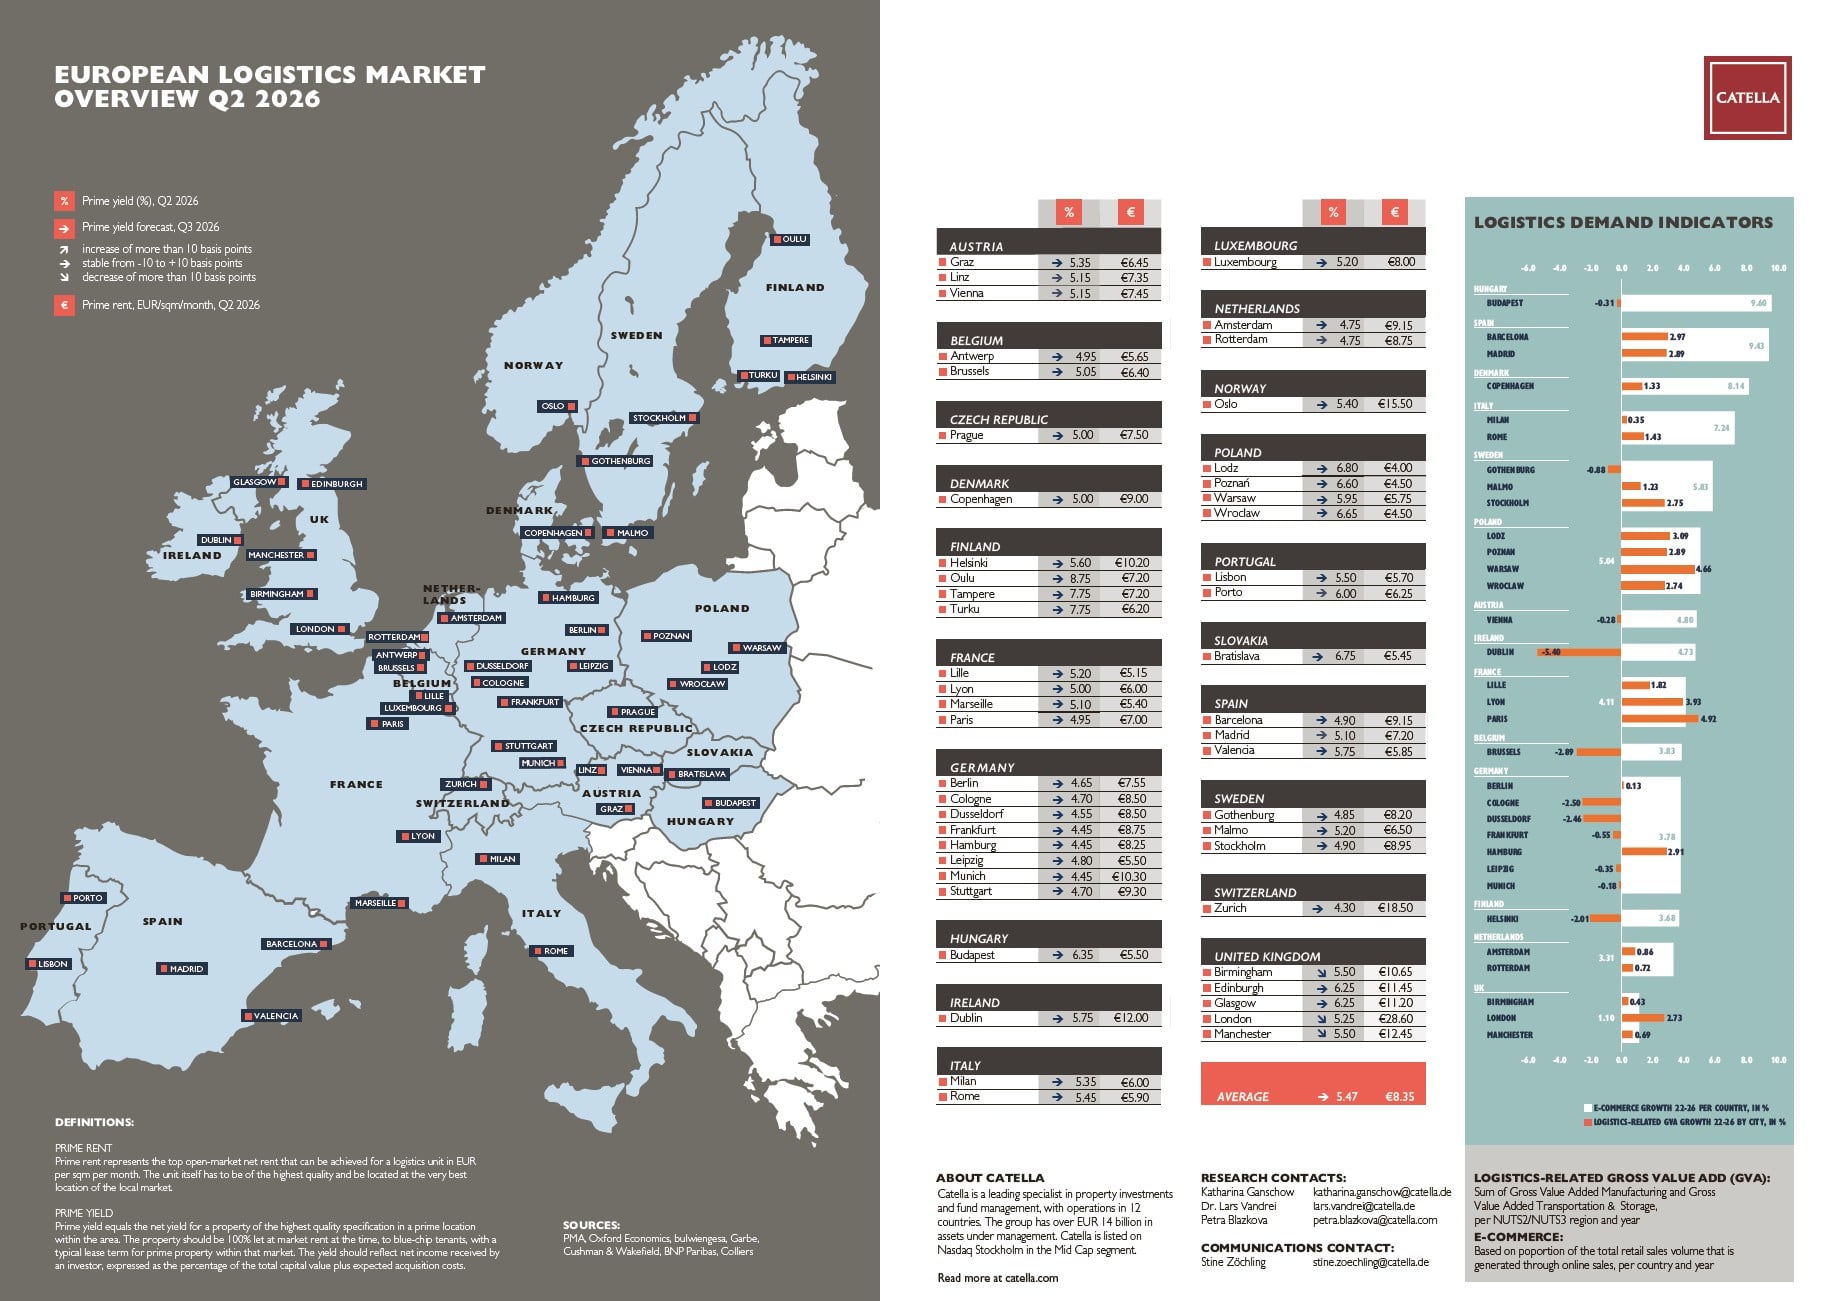
Catella has published its new European logistics map. The European Logistics Market Overview Q2 2026 covers 50 markets across 20 countries and provides an up-to-date overview of prime yields, rental levels, and the structural demand drivers behind Europe's logistics sector.
After several years defined by exceptional rental growth and yield compression, Europe's logistics markets are settling into calmer waters. Prime yields remain broadly stable and rental growth has plateaued – signs that the sector's exceptional growth phase is ending. Yet in the current geopolitical turbulence, that very stability underlines logistics real estate as a resilient asset class supported by secure income returns and rental growth.
"The hyper-growth phase is over – and that's a healthy development. The market is finding its own benchmark, with occupiers and owners alike recalibrating their expectations," says Katharina Ganschow, Research Manager at Catella Investment Management.
Logistics property pricing: Europe stands still, Italy swings back
Across almost all markets, prime yields are either holding stable or moving out selectively. The unweighted average prime yield across the analysed markets stands at 5.47% in Q2 2026, a +20 basis points change since the last published logistics map.[1] Italian logistics markets, Milan in particular, stand apart: after an overcorrection in the previous year, Milan and Rome are now compressing again (-15 bps and -25 bps respectively), effectively unwinding last year's sharp outward move rather than starting a new trend of their own.
German and French logistics markets experienced the most visible outward yield movement – for example Paris (+25 bps) which is currently at 4.95% prime yield. Elsewhere across Europe, yields are essentially flat.
Rents: logistics settles into a new normal
The average prime rent across the analysed markets stands at €8.30/sqm/month in Q2 2026, up only marginally from €8.05/sqm/month a year earlier and a +3,11% annual rental growth. Adjusted for inflation, this represents limited real rental growth, confirming the market is stabilising, absorbing increased volume of new supply that has been delivered to European markets over the last year.
This follows several years of double-digit year-on-year rental growth from a much lower base: European prime logistics rents have moved structurally from roughly €5/sqm/month to today's level of around €8/sqm/month. That structural shift now appears largely complete, with demand stabilising and the market converging on a new benchmark rather than continuing to overheat. Several markets, most notably the UK and parts of Germany, recorded no rental growth at all over the past twelve months.
Special topic: what is really driving logistics demand?
Catella Research also has explored logistics demand drivers considering the overall slowdown across the sector. For this, the research team has combined e-commerce growth per country with logistics-related gross value added (GVA) growth per city between 2022 and 2026 to identify where structural demand for logistics space is genuinely strongest.
The comparison reveals a partial decoupling between the two indicators. Strong
e-commerce growth does not automatically translate into strong logistics sector momentum: Budapest combines the highest e-commerce growth in the sample (+9.6%) with negative logistics GVA growth (-0.31%), and Dublin shows solid e-commerce growth (+4.7%) alongside the sharpest logistics GVA contraction in the dataset (-5.4%). Germany shows a similar pattern in several cities – for example Cologne and Dusseldorf, both around -2.5% GVA growth.
Conversely, Polish and French cities such as Warsaw (+4.7%) and Paris (+4.9%) stand out for genuine logistics sector momentum, combining solid e-commerce growth with above-average logistics GVA growth – underlining their role in the ongoing supply chain reconfiguration. Their combination of strong trade connectivity and diversified industrial activity gives Warsaw and Paris a structural edge that should continue to translate into above-average rental growth in the years ahead. The UK shows the lowest e-commerce growth in the sample (+1.1%), yet London still posts comparatively strong logistics GVA growth (+2.7%), a sign of resilient underlying demand even in a mature
e-commerce market.
"When occupiers commit to a market today, they're increasingly betting on the broader economy – e-commerce is no longer the dominant driver, but helps stabilise the logistics demand," adds Katharina Ganschow.
About Catella Investment Management GmbH (CIM)
Catella Investment Management GmbH (CIM) is an independent and entrepreneurial real estate investment advisor for funds and mandates with assets under management of approximately EUR 10 billion. As a subsidiary of the Stockholm-based Catella AB, CIM advises more than 25 mutual real estate funds and special real estate funds as well as several mandates across 15 European countries, with a focus on residential, mixed-use, parking, and logistics properties. CIM provides (advisory) services in research, portfolio management, acquisitions, disposals, and asset management. The company operates offices in Berlin, Munich, and Vienna.
For further information:
Catella Investment Management GmbH
Stine Zöchling
Head of Marketing and Public Relations
Office: +49 (0)30 887 285 29 76
Mobile: +49 (0)151 544 51 005
Email: stine.zoechling@catella.de
Disclaimer:
This is a marketing release. It is for information purposes only and does not constitute investment advice, an investment recommendation, an offer or an invitation to buy or sell investment products. The information is not suitable for making a concrete investment decision on its basis. It does not contain any legal or tax advice. The provision of the information does not create any contractual obligation or any other liability
towards the recipient or third parties. Shares may only be purchased on the basis of the currently valid Terms and Conditions of Investment in conjunction with the currently valid Sales Prospectus.
[1] As the underlying set of analyzed markets has evolved between Q2 2025 and Q2 2026, this comparison of average prime yield is based on the subset of markets covered in both periods, to ensure like-for-like comparability.